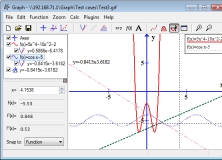
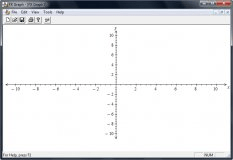
It can be used to draw mathematical graphs in a coordinate system.
Present your data in 2D/3D graphs and perform statistical analysis.
Plot math equations and scatter points using equations and data points.
RJS Graph produces professional scientific and mathematical graphs.
FX Graph is different to most graphing packages - it is dead simple.